Analyst Profile Analysis
In this short tutorial you will discover which Wall Street analysts you should trust by:
- Adjusting ranking options to match your investment strategy
- Analyzing the analyst’s stock coverage
- Seeing how well analysts perform on a specific stock
Go to Best-Rated Analysts
Start NowFollow Best-Rated Analysts with Analyst Analysis Page
Every day TipRanks scans the web for recommendations from nearly 4,800 analysts. The best part: TipRanks tracks the performance of these experts and ranks them using unbiased, objective algorithms so investors can follow analysts according to their objectively measured performance.
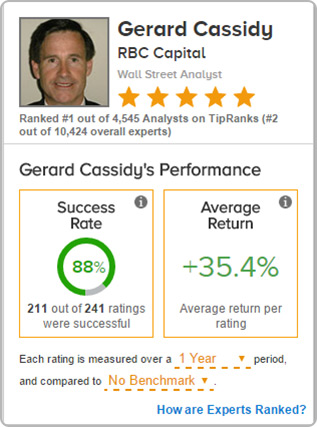
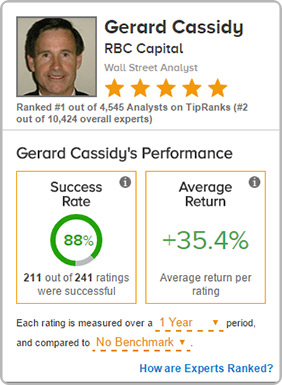
For example, in the screenshot below you can see that Gerard Cassidy is the best analyst on TipRanks out of 4,545 analysts at the time of writing. His 241 recommendations were profitable 88% of the time and he has an impressive 35.4% average return.
Have you recently read an analyst’s commentary on a financial news website? How does that analyst rank? Search their name on TipRanks to find out. All analysts are measured based on the default one-year investment horizon. However, investors with different holding periods can set the measurement period accordingly:
Short term investors: measure analyst performance by one-month trades.
Longer term investors: find the best-performing analysts over 1 or 2 years for example.
As soon as you click on the analyst’s analysis page you discover the analyst’s ranking and star rating. These two key statistics enable investors to quickly assess how the analyst compares to the other analysts tracked by TipRanks. As a result, they are the perfect indicators of who to track for the most profitable returns.
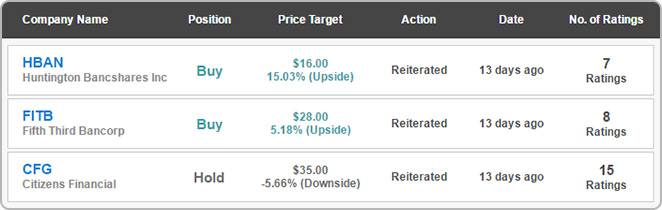
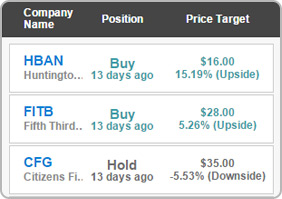
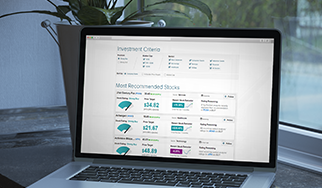
The stock coverage of the selected analyst is displayed in a list similar to the one above. You can see: the company name, position (buy, sell, hold), price target, action (reiterated,assigned, upgraded, downgraded) and the date of the recommendation. Also note the analyst’s best trade and recommendation distribution between buy, sell and hold.
See a stock that interests you? Check out the analyst’s success rate and average return for that specific stock.
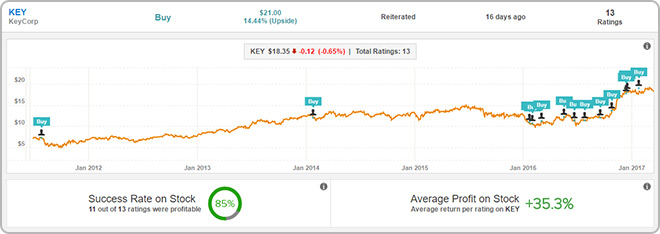
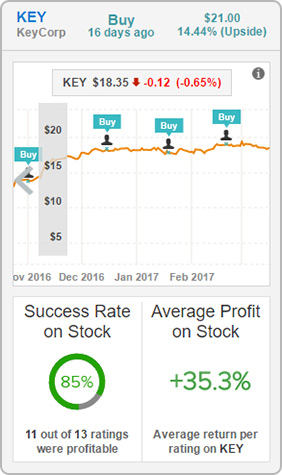
TipRanks tells users whether an analyst is an expert on each stock as well as their overall performance. Perhaps a top-rated analyst has a poor track record on a certain stock or vice versa.
Either way- it’s good to know. Click on the ‘see all ratings’ button to pull up a graph like the one above (in this example - by analyst Gerard Cassidy covering KEY stock)
The result: all the analyst’s ratings for that stock are displayed on the graph so you can immediately see the distribution of buy/ sell/ and hold ratings. Here for example you can see that the analyst has become more bullish on KEY over time.
Follow the analyst by clicking the blue ‘follow’ button on the top right of the page to stay updated on all the best analyst activity.
Click here to follow recommendations
made by the best-rated analysts on TipRanks today