TRENDING STOCKS
In this short tutorial you will learn how to find the hottest stocks on Wall Street by:
- Filtering search options to fit your strategy
- Analyzing the stock results
- Discovering all the ratings for the stocks that interest you
Go to Trending Stocks
Start NowFind Investing Inspiration with the Trending Stocks tool
TipRanks’ new Trending Stocks tool takes advantage of our big data capabilities to scan stock recommendations from over 4,600 analysts, giving users the most up-to-date and objective picture of the market while revealing which stocks analysts are really getting excited about.
At the click of a button users can discover the best, worst and most rated stocks in the last few days. Looking for investment ideas? This is a great place to start.
Trending Stocks
Our transparent, unbiased technology uses Natural Language Processing (NLP) algorithms to provide a data-driven measure of accuracy based on the statistical ability of an expert to generate profits and make correct stock recommendations.
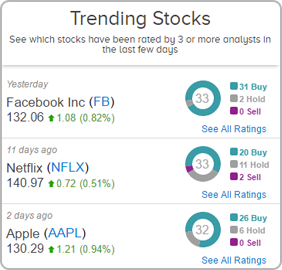
First, select the type of trending stocks that you’re looking for. A trending stock means that 3 or more recommendations have recently been made on the stock. Filter the stock selection on the left of the screen using four key categories.
- Want to know what’s hot but also what’s not? Choose from the best, worst or most rated stocks by analysts.
- Interested only in the very latest trending stocks? Choose stocks that have trended in the last 72 hours, 7 days or 30 days.
- Getting to grips with big names or prefer something a bit smaller? Choose the market cap size ( <$5b, $5b-$10b,>$10b).
- Only care about a certain sector? Choose between 8 primary sectors so that you can find investing inspiration in the exact sectors that you find the most interesting.
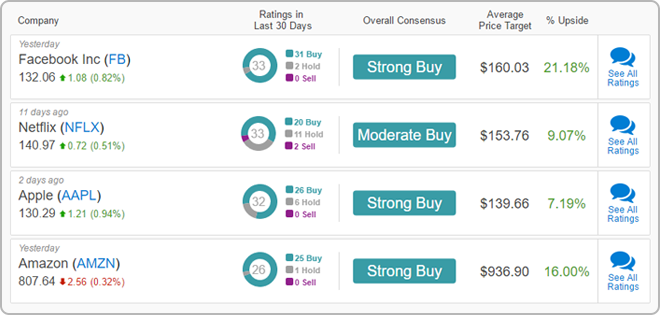
Each result provides an insight into analyst activity on a particular stock. You can see when the stock’s last analyst recommendation was, its share price, the proportion of analysts who gave the stock a buy/ sell/ hold rating.
Two key features: the analyst overall consensus rating and the average analyst 12-month price target. The upside/ downside % reveals how far the average price target is from the current share price so you can see how analysts think the stock’s price will perform in the next 12 months.
To dig deeper, click on the “See all ratings” button to go to a stock’s analysis page. Here you will find the full breakdown of all analyst ratings on that stock as well as all recommendations from other experts like financial bloggers, corporate insiders and hedge fund managers.
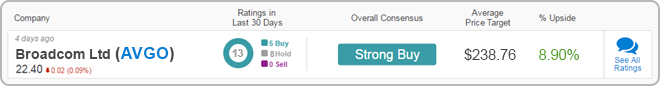
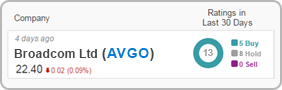
For example, in the screenshot above you can see how, at the time of writing, Broadcom is a top trending stock with 13 recent buy ratings and a strong buy analyst consensus. The average analyst price target is 8.9% above the current share price.
See What’s Hot (Or Not) By Visiting
TipRanks’ Trending Stocks Page Today