


crowd insights
Compare your portfolio to the most profitable investors on TipRanks
In this short post, we cover:
- Best-performing crowd insights
- How assets are allocated
- Top stocks from each sector
Go to our crowd insights page now
Start NowCompare your portfolio to the most profitable investors on TipRanks
A groundbreaking new crowd insights feature has been released for the award-winning Smart Portfolio platform. Investors can now compare their portfolios to a portfolio constructed out of the holdings of the most profitable TipRanks investors.
Compare your own portfolio to the top 10% of portfolios that generate the highest return for the lowest risk. The tool allows you to gain investing insights from investors who were able to consistently outperform the market.
See how your portfolio measures up to the best-performing portfolios by understanding how these portfolios allocate assets, where the highest dividend yield can be found, and which holdings are the most effective at reducing risk.
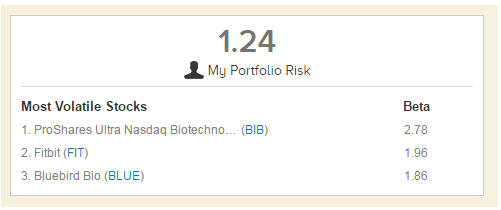
Portfolio risk
Compare your portfolio’s Beta to that of the Best Performing Portfolio on TipRanks and evaluate whether your portfolio risk is higher or lower than other investors on the TipRanks platform.
For example, the page reveals that my portfolio is actually 64% more volatile than other TipRanks portfolios. I can see that my riskiest stocks, BIB, FIT and BLUE are not held by the best-performing portfolios whose riskiest stocks are AMD; MU and AVGO.
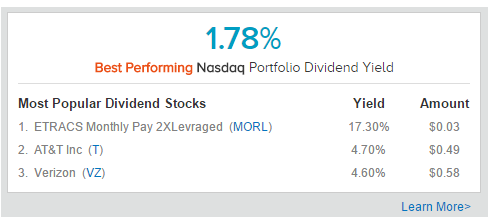
Portfolio dividend
You can also check out which are the top dividend yielders in the Best Performing TipRanks Portfolio to find viable options for boosting your portfolio dividend yield.
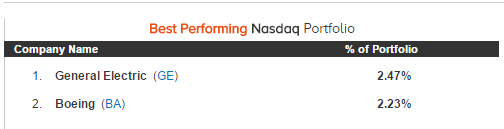
Top stocks by sector
We also give you the breakdown of stock holdings in the best-portfolios by sector so you can select the sector most relevant to your stocks. If we select the Industrial Goods sector, for example, we can immediately see that General Electric (GE) and Boeing (BA) are the two stocks most likely to be found in the top portfolios:
How does your portfolio compare in asset allocation and stock allocation? Is your portfolio more risky than the best-performing portfolios? Is your dividend yield higher or lower?
Find out all this and more on the Crowd Insights page- just one of a suite of tools available on the award-winning Smart Portfolio platform.
See how your portfolio shapes up now >You may also like these investing tools:

Have a question? Contact support@tipranks.com
