


my perfomance
Measure your stocks or portfolio against the sector and S&P 500
In this short post, we cover the different features of the My Performance page including:
- Your profile and how you rank
- Portfolio details including your best trade
- Recent activity on all your stocks
Go to our new performance page now
Start NowSee How You Rank - ‘My Performance Page’
Compare your investing performance to thousands of investors
The My Performance page lets you compare your investing performance to thousands of other investors. You can also measure your stocks or portfolio against the sector or even the S&P 500. Use the My Performance page- the latest in a series of updates to the award-winning Smart Portfolio platform- to adjust your investment strategy and take advantage of new crowd insights.
My Performance Features
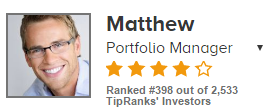
Profile
How do you compare to other investors? See your own star rating now. You can also check out your investor ranking from a pool of thousands of investors and see whether your ranking rises or falls with new trades.
How do we calculate your ranking? This depends on whether you are measured as a ‘stock picker’ or ‘portfolio manager’. If you allocate funds at least five of your selected stocks by updating the share count in the Smart Portfolio you will be measured as a portfolio manager (as well as a stock picker).
Stock Picker
For a stock picker, every transaction is measured on a standalone basis, without values or quantities. Each buy or sell action you make is simply treated as a “recommendation”, in a similar manner to analysts. When you buy a stock, our system interprets it as a one-year recommendation on that stock; however, if you close that position earlier, it measures performance only up to that point.
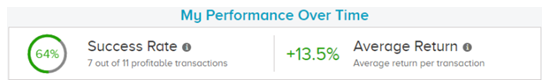
The first indicator “Success Rate” measures your hit ratio; each trade (or recommendation) you make either yields a profit or loss. The success rate is determined by the total amount of your successful trades divided by the total number of trades. The “Average Return” is an indicator of how well your picks performed. It represents the average gain/loss of your trades.
Stock pickers can also adjust two key metrics. First, select the performance benchmark to which your investments will be compared. See how your performance compares to the sector or the S&P 500. Have you outperformed a simple S&P 500 index, and by how much?
You can also set the time-period that the positions are left open, in order to best fit your investment strategy. Short term investors select one or three months. For longer term investors, the default one year option is best.
Portfolio Manager
How well can you manage a portfolio? The ranking for portfolio managers is weighted based on the proportion of each stock in your portfolio. It reveals whether you can correctly judge which stocks you should allocate most of your funds. A portfolio manager will see something like this:
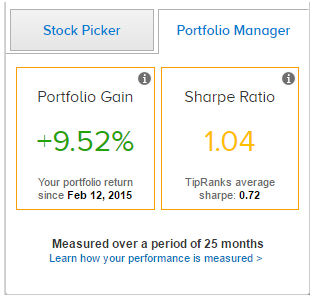
Check the Sharpe ratio to discover how consistent were your returns over time. The Sharpe ratio of your investment calculates the average return earned in excess of the risk-free rate per unit of volatility or total risk. In other words, a higher ratio indicates minimal risk for maximum return. Is your portfolio more or less risky than the average user?
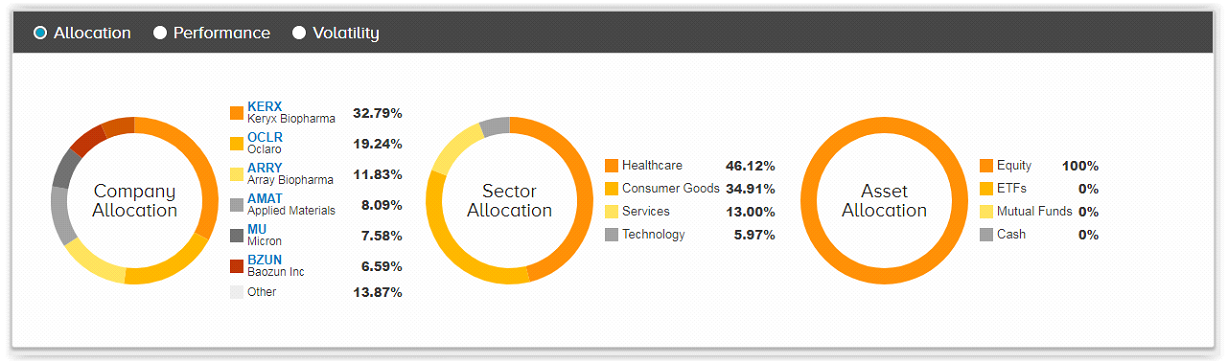
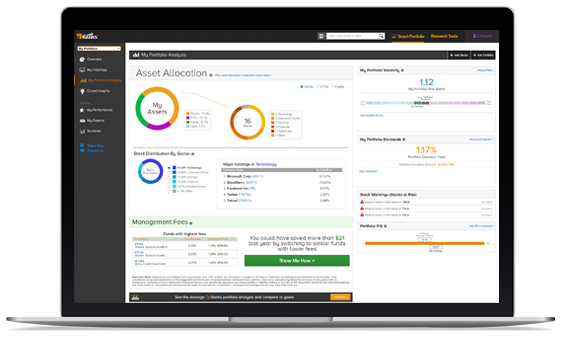
Portfolio Analysis
The page contains valuable additional portfolio details including: company, asset and sector allocation; monthly performance statistics measured against the S&P 500 and top-performing investors; as well as the portfolio risk (beta) and your portfolio’s most volatile stocks. You can see your six most volatile stocks ranked by beta- a key indicator of which stocks to reduce exposure to if you want to make your portfolio less volatile.
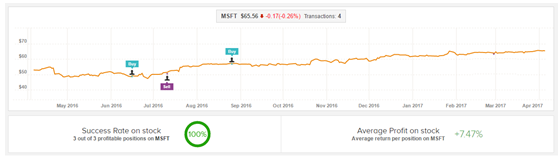
Check out your most profitable shareholding with this neat new feature. Check out how much you have made on your best trade since opening the position.
Recent Activity
All your recent stock activity displayed on one page. This helpful summary includes all the crucial investing information including the gain/ loss you have made so far from each investment. Dig deeper by clicking on a stock to see how your transactions correlate with that stock’s price movements. You can then discover your success rate and average return for each of your specific stocks.
Stock Reassurance
Looking for further stock reassurance? Hundreds and thousands of investors are successfully using Smart Portfolio to take full control over their holdings and make the best-informed investment decisions by utilizing relevant news and personalized analytics. You can too.
Go to explore the Smart Portfolio today >You may also like these investing tools:
Have a question? Contact support@tipranks.com
