stock page analysis
In this short tutorial you will learn how to analyze the outlook for stocks from multiple angles:
- See stock consensus of top finance experts
- Stay updated on all your bullish/bearish stock news
- Discover the investor sentiment on your stocks
- Analyze a range of stock charts and find similar stocks
See what 15,000 financial experts say about your stocks
Start NowCONDUCT IN-DEPTH ANALYSIS ON YOUR STOCKS BASED ON TIPRANKS’ UNIQUE MARKET INSIGHTS
Our goal at TipRanks is to bring transparency and accountability to the markets. Every day,TipRanks analyzes the buy and sell recommendations on over 5,000 stocks from four types of financial experts- analysts, bloggers, hedge funds and corporate insiders. This means that TipRanks users get the full lowdown on their favorite stocks all on one simple page.
With helpful info spanning buy/ sell ratings and the upside/ downside potential of the share price, this is the crucial page for investors who want to understand how the market believes their stocks will perform.
With helpful info spanning buy/ sell ratings and the upside/ downside potential of the share price, this is the crucial page for investors who want to understand how the market and top investors believe their stocks will perform. TipRanks uses its unique NLP and machine learning to create several different research angles including research, investor sentiment, charts and news. Let’s take a closer look now.
Research
TipRanks tracks the performance of over 15,000 experts rating these stocks and ranks the experts using unbiased, objective algorithms. Cut out underperforming individuals and look for five or four-star experts to beat the market.
Wall Street analysts
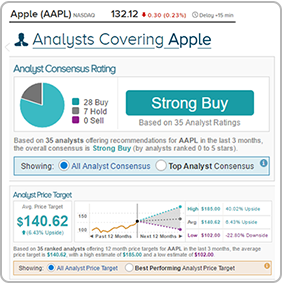
Let’s start with two of the Stock Page’s most valuable tools. The analyst consensus rating reveals whether the majority of analysts in the last 3 months have a buy, sell or hold recommendation while the average analyst 12- month price target indicates how analysts see the stock’s price moving. You can scroll down the page to see the star ratings of the analysts making the recommendations.
In the screenshot below we can see that, at the time of writing, the analyst consensus rating for AAPL is strong buy while the average analyst price target reveals a 6.43% potential upside from the current share price (at the time of writing).

Bloggers
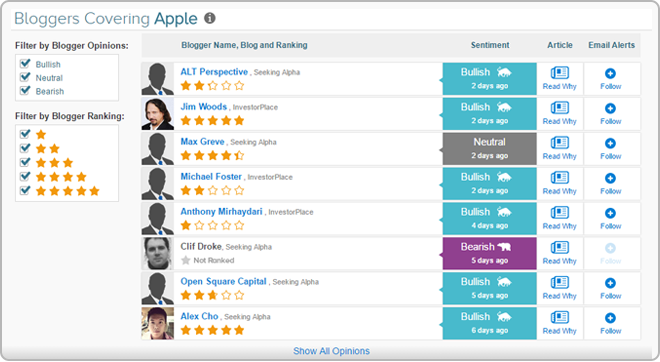
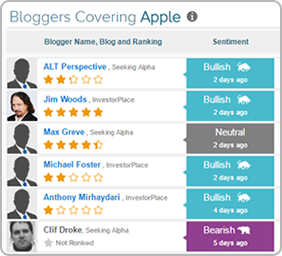
Use the sidebar to explore the position of different experts- are top-rated financial bloggers bearish or bullish opinion on the stock? Click on the article logo to read the accompanying blog post and filter bloggers by opinion and by ranking.
Insiders
You can also get the lowdown on insider transactions. TipRanks has a unique capability to differentiate between uninformative and informative insider transactions so that investors can select only informative transactions that represent the insider’s intention.
Hedge fund managers
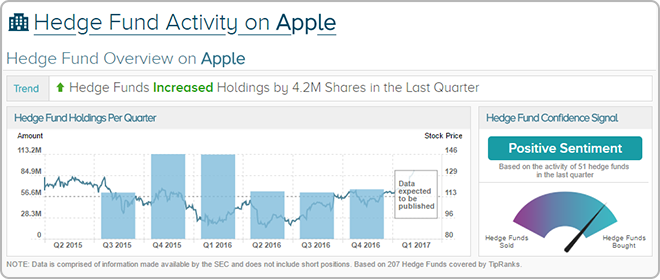
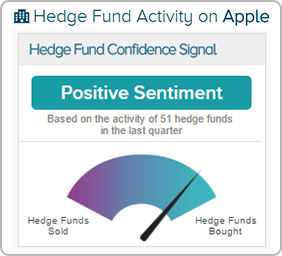
Similarly, check whether hedge fund managers have been buying or selling the stock in the last quarter. What’s the hedge fund sentiment on your stock? This is the place to find out.
Individual Investor Sentiment
The Individual Investor Sentiment feature enables users to harness the wisdom of the crowd. TipRanks generates powerful portfolio insights based on thousands of investor portfolios, and utilizes this wisdom to generate new investing ideas.
Are investors positive or negative on your stock selection? Discover the portfolio percentage individual investors allocate, on average, to any one of over 5,000 stocks in TipRanks’ coverage universe. Compare your stock selection to the top 10% of TipRanks portfolios that generate the highest return for the lowest risk.


Here we include both the breakdown of investors holding a stock, as well as the average performance of that age group. Interestingly, at the time of writing, we can see that the 35-55s boast the highest monthly average return, but also the highest risk (beta) and the lowest dividend yield.
This section also reveals top sector stocks and similar stocks that the best-performing investors are snapping up. You can flick between four types of investors to analyze the most popular stocks by age/ performance.


News
Every stock page also has a news section with bullish/ bearish news from all over the web. The purpose of this is to enable you to take advantage of the proven correlation between news and stock performance. This unique tool brings hedge-fund capability to individual investors. Here we can see how Apple has a bullish news sentiment score which matches the sector average.

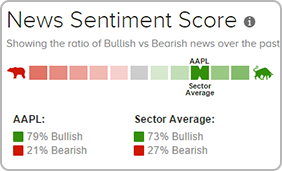
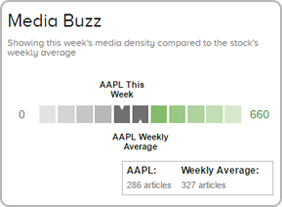
You can use this in correlation with the media buzz score. If the media density is notably higher than the weekly average it suggests that a significant event has occurred, for example an earnings report or a new model release, that could cause the stock price to surge or slump. The news sentiment score reveals the likely price direction.

Charts
Now turn to the charts section. TipRanks has just created five clear and intuitive charts that deliver all the essential stock info - from dividend yield range and short interest to trading volumes and price to earnings ratios. The result: you can easily incorporate stock charts as part of your TipRanks investing analysis process.
Plus scroll down to the final section to find similar stocks in the same sector. These stock suggestions can provide you with a neat source of fresh investing inspiration. For example, similar stocks to Apple include Verizon (VZ) and Microsoft (MSFT).
Now it’s your turn.
Discover New Insights on Your Stocks
with the Stock Analysis Page


